
IPL Points Table on 7 April, Most Runs, Most Sixes and Other Stats for IPL 2025

IPL Points Table: The 19th league stage match of the TATA IPL 2025 was played between Gujarat Titans and Sunrisers Hyderabad was played at the Rajiv Gandhi International Stadium, Hyderabad where the home team lost another one and they are at the bottom of the IPL Points Table on 7th April.
There isn't much to explain what happened in the match as when there is SRH at one corner, one can expect such an event where either they smash 250-odds or won't even close in 190-200. This is what their playing style does to them.
Gujarat Titans won the toss and opted to bowl first. Mohammad Siraj drew the first blood, perhaps the most important one, of Travis Head. He was blazing fire and got four scalps. Prasidh Krishna also got two wickets in the middle overs and GT managed to restrict SRH to under 152 runs.
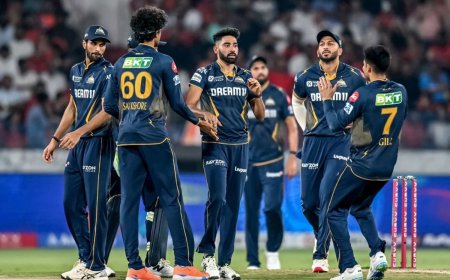
With two early wickets, GT was on the backfoot but the exceptional partnership between skipper Gill and Washington Sunder got GT on top. They cracked the target under 17 overs and won by 7 wickets.
Below are the latest stats and IPL Points Table after SRH vs GT match:
IPL Points Table 2025
| Rank | Team | Mat | Won | Lost | Tied | NR | Pts | NRR |
|---|---|---|---|---|---|---|---|---|
| 1 | Delhi Capitals | 3 | 3 | 0 | 0 | 0 | 6 | +1.257 |
| 2 | Gujarat Titans | 4 | 3 | 1 | 0 | 0 | 6 | +1.031 |
| 3 | Royal Challengers Bengaluru | 3 | 2 | 1 | 0 | 0 | 4 | +1.149 |
| 4 | Punjab Kings | 3 | 2 | 1 | 0 | 0 | 4 | +0.074 |
| 5 | Kolkata Knight Riders | 4 | 2 | 2 | 0 | 0 | 4 | +0.070 |
| 6 | Lucknow Super Giants | 4 | 2 | 2 | 0 | 0 | 4 | +0.048 |
| 7 | Rajasthan Royals | 4 | 2 | 2 | 0 | 0 | 4 | -0.185 |
| 8 | Mumbai Indians | 4 | 1 | 3 | 0 | 0 | 2 | +0.108 |
| 9 | Chennai Super Kings | 4 | 1 | 3 | 0 | 0 | 2 | -0.891 |
| 10 | Sunrisers Hyderabad | 5 | 1 | 4 | 0 | 0 | 2 | -1.629 |
Delhi Capitals are off to a flying start, undefeated in three games with a strong NRR. Gujarat Titans and RCB follow closely. Sunrisers Hyderabad are struggling, with just one win in five games.
Most Runs - Top 10 Batters
| Rank | Player | Matches | Inns | Runs | Avg | SR | 4s | 6s |
|---|---|---|---|---|---|---|---|---|
| 1 | Nicholas Pooran | 4 | 4 | 201 | 50.25 | 218.48 | 18 | 16 |
| 2 | Sai Sudharsan | 4 | 4 | 191 | 47.75 | 150.39 | 16 | 9 |
| 3 | Mitchell Marsh | 4 | 4 | 184 | 46.00 | 185.86 | 22 | 10 |
| 4 | Suryakumar Yadav | 4 | 4 | 171 | 57.00 | 161.32 | 15 | 8 |
| 5 | Jos Buttler | 4 | 4 | 166 | 55.33 | 167.68 | 14 | 9 |
| 6 | Shreyas Iyer | 3 | 3 | 159 | 159.00 | 206.49 | 10 | 13 |
| 7 | Heinrich Klaasen | 5 | 5 | 152 | 30.40 | 168.89 | 13 | 7 |
| 8 | Travis Head | 5 | 5 | 148 | 29.60 | 189.74 | 21 | 6 |
| 9 | Shubman Gill | 4 | 4 | 146 | 48.67 | 148.98 | 16 | 5 |
| 10 | Aniket Verma | 5 | 5 | 141 | 28.20 | 183.12 | 8 | 12 |
Nicholas Pooran leads the batting chart with explosive form. Shreyas Iyer impresses with a stunning average of 159.00. Consistency and aggression are defining the top-order battles.
Most Wickets - Top 10 Bowlers
| Rank | Player | Matches | Overs | Balls | Wkts | Avg | Runs | 4-fers | 5-fers |
|---|---|---|---|---|---|---|---|---|---|
| 1 | Noor Ahmad | 4 | 15.0 | 90 | 10 | 11.80 | 118 | 1 | - |
| 2 | Mohammed Siraj | 4 | 16.0 | 96 | 9 | 13.78 | 124 | 1 | - |
| 3 | Mitchell Starc | 3 | 11.4 | 70 | 9 | 11.56 | 104 | - | 1 |
| 4 | Ravisrinivasan Sai Kishore | 4 | 16.0 | 96 | 8 | 14.12 | 113 | - | - |
| 5 | Hardik Pandya | 3 | 10.0 | 60 | 8 | 9.38 | 75 | - | 1 |
| 6 | Khaleel Ahmed | 4 | 16.0 | 96 | 8 | 15.00 | 120 | - | - |
| 7 | Shardul Thakur | 4 | 13.0 | 78 | 7 | 18.86 | 132 | 1 | - |
| 8 | Kuldeep Yadav | 3 | 12.0 | 72 | 6 | 12.00 | 72 | - | - |
| 9 | Varun Chakaravarthy | 4 | 15.0 | 90 | 6 | 15.67 | 94 | - | - |
| 10 | Josh Hazlewood | 3 | 11.5 | 71 | 6 | 14.33 | 86 | - | - |
Noor Ahmad tops the bowling list with 10 wickets, followed by Siraj and Starc who’ve been lethal with the new ball. Hardik Pandya is proving to be a valuable all-rounder with 8 wickets at an average under 10.
Most Sixes
| Rank | Batter | Matches | Inns | Runs | 6s |
|---|---|---|---|---|---|
| 1 | Nicholas Pooran | 4 | 4 | 201 | 16 |
| 2 | Shreyas Iyer | 3 | 3 | 159 | 13 |
| 3 | Aniket Verma | 5 | 5 | 141 | 12 |
| 4 | Mitchell Marsh | 4 | 4 | 184 | 10 |
| 5 | Ajinkya Rahane | 4 | 4 | 123 | 10 |
Nicholas Pooran leads the big-hitting brigade with 16 sixes. Shreyas Iyer and Aniket Verma aren't far behind, showing their aggressive intent early in the tournament.
Most Fours
| Rank | Batter | Matches | Inns | Runs | 4s |
|---|---|---|---|---|---|
| 1 | Mitchell Marsh | 4 | 4 | 184 | 22 |
| 2 | Travis Head | 5 | 5 | 148 | 21 |
| 3 | Nicholas Pooran | 4 | 4 | 201 | 18 |
| 4 | Sai Sudharsan | 4 | 4 | 191 | 16 |
| 5 | Shubman Gill | 4 | 4 | 146 | 16 |
Marsh and Head dominate the boundary charts, with clean and consistent strokeplay. Pooran makes another appearance, highlighting his well-rounded batting form.
Best Strike Rates
| Rank | Batter | Matches | Inns | Runs | Avg | SR |
|---|---|---|---|---|---|---|
| 1 | Abdul Samad | 3 | 3 | 53 | 26.50 | 240.91 |
| 2 | Nicholas Pooran | 4 | 4 | 201 | 50.25 | 218.48 |
| 3 | Ashutosh Sharma | 2 | 2 | 67 | 67.00 | 209.38 |
| 4 | Tim David | 3 | 2 | 54 | 54.00 | 207.69 |
| 5 | Shreyas Iyer | 3 | 3 | 159 | 159.00 | 206.49 |
| 6 | Travis Head | 5 | 5 | 148 | 29.60 | 189.74 |
| 7 | Nitish Rana | 4 | 4 | 112 | 28.00 | 186.67 |
| 8 | Shashank Singh | 3 | 2 | 54 | - | 186.21 |
| 9 | Mitchell Marsh | 4 | 4 | 184 | 46.00 | 185.86 |
| 10 | Aniket Verma | 5 | 5 | 141 | 28.20 | 183.12 |
Abdul Samad explodes at the top with a blazing strike rate of 240.91. Pooran, Marsh, and Shreyas Iyer continue to feature prominently, proving their dominance this season.